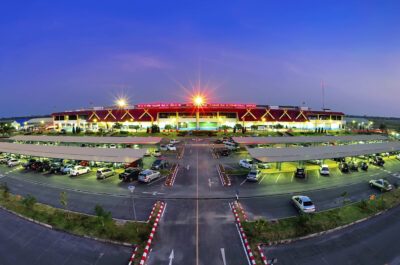


In Asia-Pacific, South Korean airports appear to have recovered fully from the Middle East Respiratory Syndrome (MERS) outbreak in 2015.
HONG KONG – In August 2016, Asia-Pacific and Middle East delivered passenger traffic increase at +7.5% and +8.1% respectively in the midst of an overall easing in growth momentum globally.
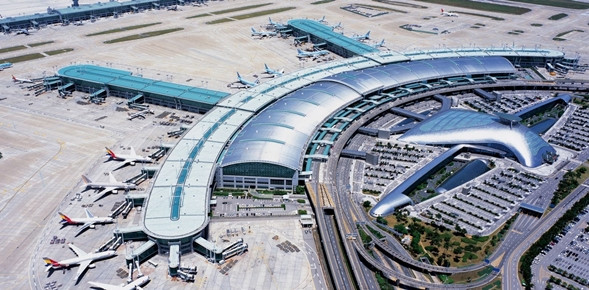
In Asia-Pacific, South Korean airports appear to have recovered fully from the Middle East Respiratory Syndrome (MERS) outbreak in 2015. Many airports reported robust growth for the month led by: Seoul Incheon (ICN) +22.5%, Busan (PUS) +17.8%, Jeju (CJU) +12.3%.
Domestic passenger travels continued to stimulate growth in India. Many airports reported growth in excess of 20% in August 2016. Top runners include: Ahmedabad (AMD) +26.2%, Goa (GOI) +25.6% and Hyderabad (HYD) +25.2%.
In China and Japan, growth in the current month was largely driven by gains in international passengers. Kunming (KMG) led growth in China at +11.7% and Naha (OKA) led in Japan at +11.5% in terms of total passenger traffic. Both airports recorded substantial international passenger growth of +21.7%.
In the Middle East, Muscat (MCT) and Doha (DOH) were in leading positions reporting passenger traffic gains at +18% and +17.4% respectively for the month.
Regarding air freight, despite global trade growth remaining sluggish, in August 2016 Asia-Pacific and Middle East generated increase at +4.5% and +3.5% respectively.
Top freight hubs in Asia-Pacific delivered solid increase for the month: Hong Kong (HKG) +3.5%, Shanghai Pudong (PVG) +2.6% and Incheon (ICN) +3.2%. Shenzhen (SZX) +13.11% generated the highest growth in the region.
The result in the Middle East was mixed, air freight volumes at the largest hub Dubai (DXB) shrank -3% for the month while Doha (DOH) continued to expand at a fast pace at +20.2%.
TABLE 1: Airports reporting highest preliminary year-on-year traffic growth rates in August 20161
| Top 3 airports by size category2 | ||||
| Passenger | Freight | |||
| > 40M | 25M to 40M | 15M to 25M | 5M to 15M | |
| Beijing (PEK) +6.8% | Tokyo Narita (NRT) +2.6% | Kansai (KIX) +3.7% | Osaka Itami (ITM) +4.3% | Hong Kong (HKG) +3.5% |
| Dubai (DXB) +6.1% | Shanghai Hongqiao (SHA) +5% | Seoul Gimpo (GMP) +5.5% | Phuket (HKT) +16.9% | Shanghai Pudong (PVG) +2.6% |
| Tokyo Haneda (HND) +4.5% | Doha (DOH) +17.4% | Abu Dhabi (AUH) +2.3% | Busan (PUS) +17.8% | Seoul Incheon (ICN) +3.2% |
Note :
- ACI preliminary passenger and freight statistics are based on a significant sample of airports that provide regular monthly reports to ACI. They represent approximately 60% of total passenger traffic and 70% of total freight traffic worldwide. Commentary, tables and charts are based on preliminary data submitted by participating airports and are therefore subject to change.
- Size categories refer to the annual passenger traffic (in the last 12 months)
Photo caption: Seoul Incheon International Airport, South Korea

Vicky is the co-founder of TravelDailyNews Media Network where she is the Editor-in Chief. She is also responsible for the daily operation and the financial policy. She holds a Bachelor's degree in Tourism Business Administration from the Technical University of Athens and a Master in Business Administration (MBA) from the University of Wales. She has many years of both academic and industrial experience within the travel industry. She has written/edited numerous articles in various tourism magazines.


![[PR] PR_Ascott and Vimut Hospital_2024](https://www.traveldailynews.asia/wp-content/uploads/2024/04/PR-PR_Ascott-and-Vimut-Hospital_2024-400x265.jpg)