


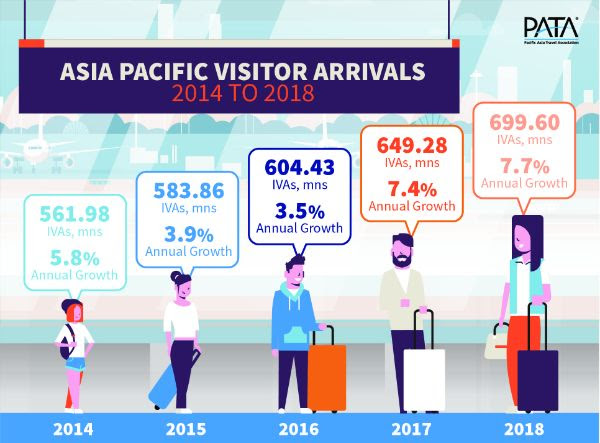
Rising from an arrivals volume of just almost 562 million in 2014, the annual growth of visitors into and across the Asia Pacific region has increased consistently each year, peaking in 2018 at 699.6 million international arrivals.
Bangkok, Thailand – Asia Pacific destinations collectively received almost 700 million international visitor arrivals (IVAs) in 2018, an increase of 7.7% over the 2017 figure, according to PATA’s Annual Tourism Monitor 2019 Early Edition released last week.
This report is the latest in a series that dates back to 1951 and, in this edition, covers 47 destinations across the Asia Pacific region. The data contained within this publication provides useful, practical data on traveller structure and movements and is an essential input into strategic, development and marketing plans for all suppliers to this significant contributor to the tourism economies of the Asia Pacific region.
Rising from an arrivals volume of just almost 562 million in 2014, the annual growth of visitors into and across the Asia Pacific region has increased consistently each year, peaking in 2018 at 699.6 million international arrivals.
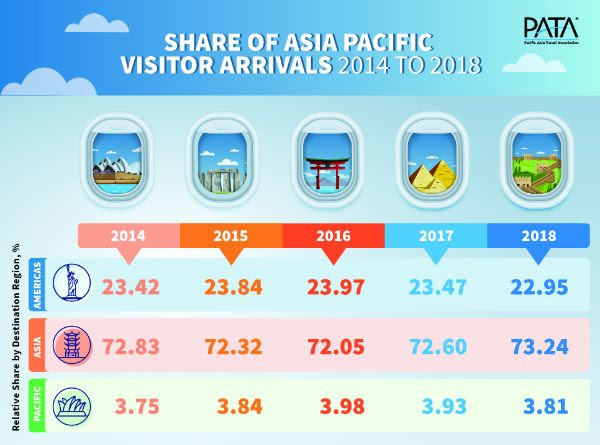
The distribution of these arrivals has been relatively constant over the past five years, although marginally favouring Asia, largely at the expense of the Americas.
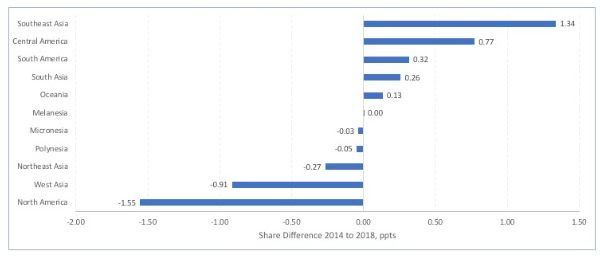
Within each of those destination regions there are differences across both individual destinations and at the sub-regional level. Between 2014 and 2018 for example, Southeast Asia gained 1.34 points of share in terms of IVAs into and across Asia Pacific, while North America lost 1.55 points of share.
IVA Share Change by Destination Sub-region 2014 to 2018, ppts
There are several main indicators of particular interest at this level, particularly the top five destinations by volume of visitor arrivals in 2018. Clearly China was the number one destination for visitor arrivals, with close to 161 million in 2018. That alone represents 22.6% of the total visitor volume into and across Asia Pacific, in that year.
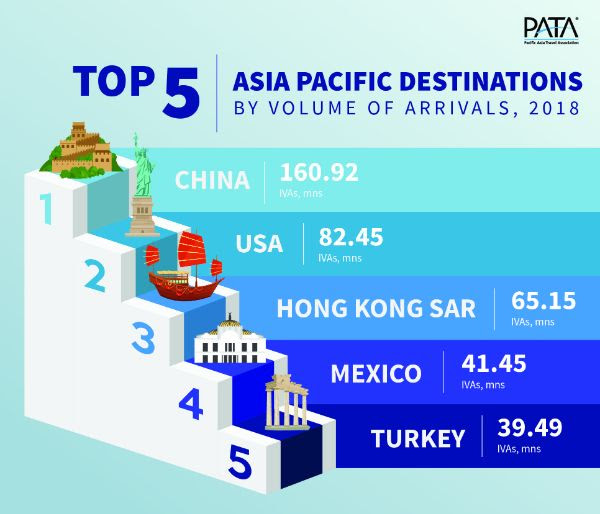
The remaining four destinations in this top five list cover North and Central America as well as Northeast and West Asia. Collectively, these top five destinations accounted for 54.8% of the total visitor arrivals into and across Asia Pacific in 2018.
A second destination indicator considers the top five destinations that received the most additional volume added to their respective inbound counts between 2017 and 2018.
This particular list is remarkably similar to the previous one, except that Mexico has been replaced by Macao, China. In total, 12 destinations of the 47 covered in this report had annual increases in excess of one million IVAs apiece between 2017 and 2018.
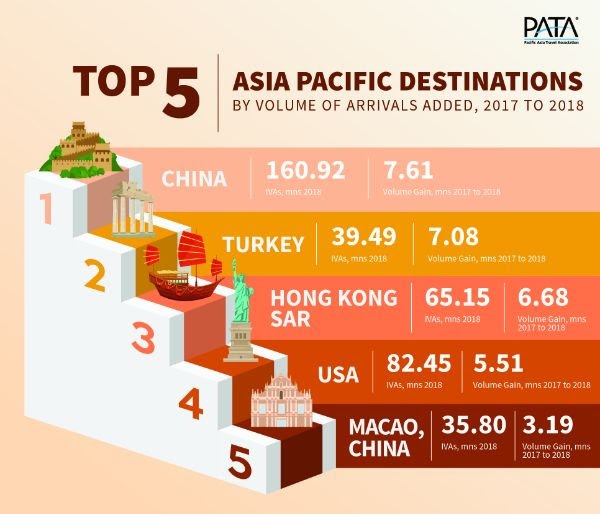
This top five group received a total of over 30 million additional arrivals between 2017 and 2018, which was just over 59% of the total net arrivals for Asia Pacific over this period.
A third indicator looks at the longer-term growth of Asia Pacific destinations, in particular, the top five destinations that showed the strongest percentage growth in arrivals between 2017 and 2018.
While the volume of arrivals varies greatly for most of these destinations, they are of particular interest given that annual growth is often a precursor to some significant tourism opportunities presenting themselves. Turkey in this regard, shows clearly how it is rebounding from the recent contractions in visitor arrivals, appearing in the top five lists by volume and annual growth rate.
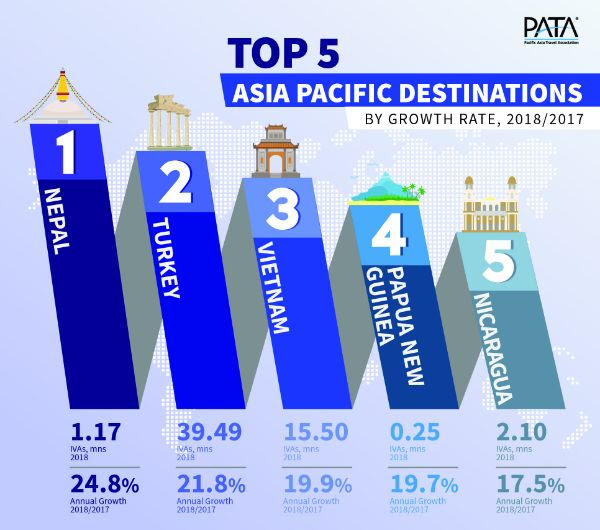
So too with Nepal, which has been on a strong growth track for a number of consecutive years now and which received more than one million foreign arrivals in a single year for the first time ever, in 2018. Similarly, with Papua New Guinea which has rebounded strongly since 2016, growing its annual growth rate strongly since then.
Over the longer term – between 2014 and 2018 – it is interesting to see the top five destinations that received the most additional IVA volume added to their inbound counts over that period. China tops the list with over 34.2 million additional arrivals added to its inbound count, followed by Japan with a gain of close to 17.8 million IVAs over that period and then Thailand with almost 13.5 million additional IVAs.
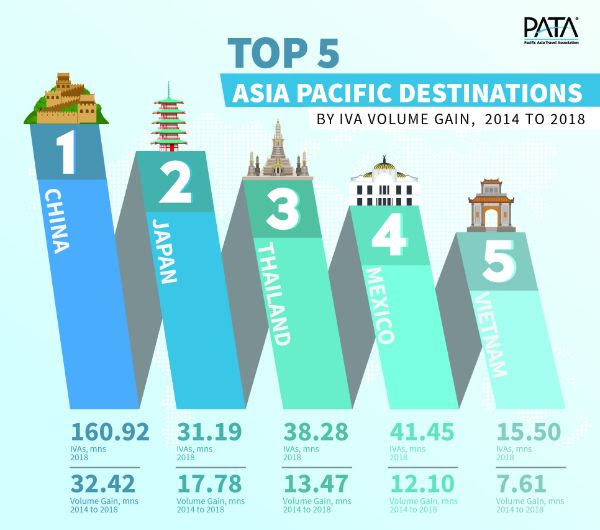
Mexico and Vietnam close out that top five list with period increases of 12.1 million IVAs and more than 7.6 million.
In similar fashion, it is interesting to see which Asia Pacific destinations had the strongest average annual growth rates (AAGRs) between 2014 and 2018, as this metric can often (but not always) indicate a more continuous growth rate over time. It is obvious that Japan and Vietnam in particular have been expanding their foreign arrivals counts with some strength, given the AAGRS of almost 24% and 18% respectively. This is supported by the fact that both of those destinations also appear in the top five list of the increase in absolute numbers of arrivals between 2014 and 2018.
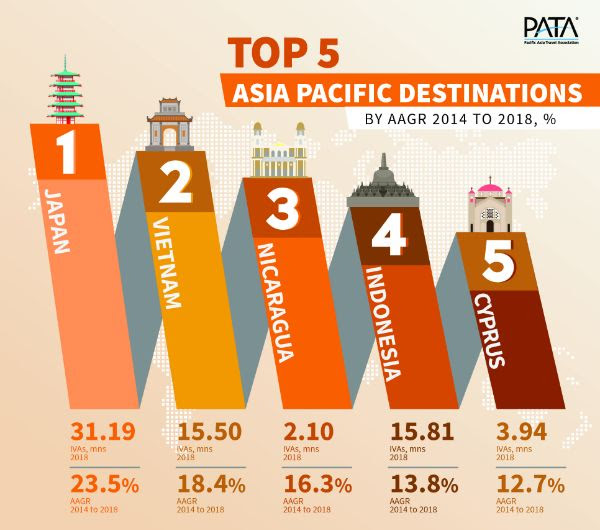
Interestingly, Nicaragua appears to have been performing well against this metric between 2014 and 2018, however that now seems to be all but unravelling, given the political issues being faced there at the moment.
In addition, and based on these top five AAGR results, Indonesia is certainly a destination to keep watching, as is Cyprus in West Asia.
PATA CEO Dr. Mario Hardy pointed out that, “across Asia Pacific, calendar year 2018 continued to demonstrate volatility in markets and destinations, some caused by external factors, including politics, but others by changes in consumer wants, needs and basic preferences.”
“While growth out of many traditional markets begins to waver or stagnate, at least into some destinations, newly emerging markets appear and offer opportunities for those agile enough to not only recognise them but also to be able to change their marketing and promotional efforts at a moment’s notice and capture those fleeting”, he added.
Dr Hardy concluded that, “everything continues to change, morph and evolve, but now it is happening at speeds unthought of just a decade ago. As an important global industry sector, we need to change even faster and get ahead of that curve, if we are to remain viable and significant into the future. To do that efficiently, like all industry sectors, we need faster and better information upon which to act, leveraged by technology. It is no longer ‘business as usual”.

Theodore is the Co-Founder and Managing Editor of TravelDailyNews Media Network; his responsibilities include business development and planning for TravelDailyNews long-term opportunities.