Global airline capacity for January 2010 shows positive growth compared to January 2009, reports OAG with its monthly report on trends in the supply of airline flights and seats. This growth marks the fifth consecutive month in which airline capacity has shown growth, with 294.6 million available seats this month, an increase of 3% over January 2009. Global frequencies are up 2% compared to January 2009, with a total of 2.37 million flights scheduled for January 2010…
 Global airline capacity for January 2010 shows positive growth compared to January 2009, reports OAG with its monthly report on trends in the supply of airline flights and seats. This growth marks the fifth consecutive month in which airline capacity has shown growth, with 294.6 million available seats this month, an increase of 3% over January 2009. Global frequencies are up 2% compared to January 2009, with a total of 2.37 million flights scheduled for January 2010. Worldwide, frequency and capacity in the low-cost sector are up by 10% compared to a year ago.
“As they should be, the airlines are cautious about the early signs of recovery and gradually increasing their capacity in the marketplace. It is a wise strategy, which should help them manage better yields as the economy recovers,” said Mario Hardy, Vice President Asia Pacific, OAG Aviation. “This is of note in Asia, as frequency and capacity both into and within the region are showing continued increases,” Hardy continued.
The North American region reflects a combination of decline and growth. Within North America, there is a reduction of 22,826 flights (2.7%) and 2,454,469 fewer seats (2.8%). However, frequency and capacity to and from the region show a positive growth of 3% in flights (2,347) and positive growth of 1% in seats (230,554). Flights to and from Europe show increases compared to January 2009, with 5% more flights and 3% more seats. Latin America, Asia, South/Central America, the Middle East and Africa are also showing increases in frequency and capacity.
Analysis of major routes reveals that while certain routes are experiencing positive growth, others continue to decline. Frequency and capacity between Western Europe and the Middle East reflect an increase of 7%, with 1002 more flights and 194,307 more seats compared to January 2009. Routes between Western Europe and Africa show healthy growth, with 3,887 more flights (increase of 19%) and 690,790 more seats (18% increase). Showing decline is the transatlantic market between North America and Western Europe, with a 5% decrease in seats (287,979). Frequencies are down 6%, with 1,274 fewer flights for the month.
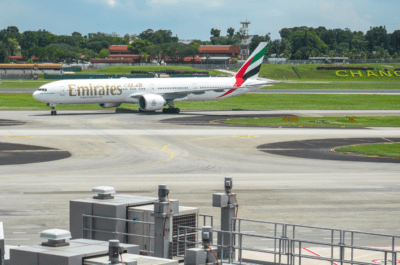
A hubs analysis reveals that Dubai has the biggest growth, with a 17% increase in frequency and capacity compared to January 2009. Singapore Changi shows a 6% increase in flight frequency (1,235 flights) and a 3% increase in capacity (131,971 seats). New York JFK shows a reduction in both flights and seats with 9% and 4% decreases respectively. Chicago O’Hare also shows a 3% reduction in seats, while gaining a marginal increase in flights (1%).
The figures are revealed in the January 2010 edition of OAG FACTS (Frequency & Capacity Trend Statistics), the dynamic monthly market intelligence tool providing the latest data on current passenger airline activity around the world. OAG FACTS uses interactive graphs to display a visual trend of the performance of a specific airport, route, country or region from 2001 onwards, sourced from OAG’s consolidated database of global airline schedules.
Theodore is the Co-Founder and Managing Editor of TravelDailyNews Media Network; his responsibilities include business development and planning for TravelDailyNews long-term opportunities.


