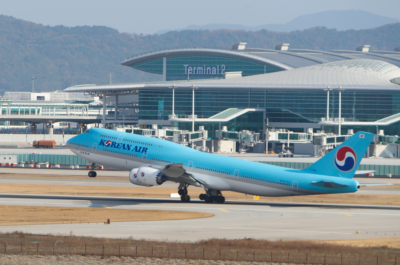


A total of 24.4 million international passengers were carried by Asia Pacific airlines in March, 4.5% more than in the same month last year. In revenue passenger kilometre (RPK) terms, international passenger demand registered a corresponding 4.7% growth.
KUALA LUMPUR, Malaysia – Preliminary traffic figures for the month of March released by the Association of Asia Pacific Airlines (AAPA) showed further growth in international air passenger demand, whereas soft air cargo market conditions persisted.
A total of 24.4 million international passengers were carried by Asia Pacific airlines in March, 4.5% more than in the same month last year. In revenue passenger kilometre (RPK) terms, international passenger demand registered a corresponding 4.7% growth. Combined with the 6.7% expansion in available seat capacity, the average international passenger load factor fell by 1.5 percentage points to 77.4% for the month.
On the other hand, air freight volumes for Asian airlines registered a decline of 5.3% despite a pick-up in Chinese exports following the Lunar New Year factory closures. Freight load factors for the region’s carriers remained under pressure, with the average international freight load factor registering a 5.2 percentage point decline to 62.9%, after accounting for a 2.6% expansion in offered freight capacity.
Commenting on the results, Mr. Andrew Herdman, AAPA Director General said, “During
the first quarter of the year, Asia Pacific airlines saw international passenger numbers increase by a solid 7.5% to an aggregate total of 72.8 million. However, international air cargo demand remained soft, with volumes declining by 6.5% compared to the same period a year ago, reflecting the general slowdown in global trade.”
Looking ahead, Mr. Herdman concluded, “Overall, the growth in demand for air passenger travel remains quite robust, supported by low oil prices and the widespread availability of affordable airfares. Some concerns remain over the global economic outlook, but the region’s airlines are continuing to invest in new aircraft, and products and services to meet the projected growth in consumer demand.”
TRAFFIC UPDATE – PRELIMINARY
International Scheduled Services of Asia Pacific Airlines

Effective September 2014, the dataset comprises aggregated traffic data from the following 31 Asia Pacific based carriers: 5J, 6E, 9W, AI, AK, BI, BR, CA, CI, CX, CZ, GA, JL, JQ, KA, KC, KE, MH, MU, NH, NZ, OZ, PG, PR, SG, SQ, TG, TR, QF, VA and VN.
• Previous year data adjusted for comparison purposes
• RPK = revenue passenger kilometres
• ASK = available seat kilometres
• FTK = freight tonne kilometres
• FATK = available freight tonne kilometres
• All figures, including estimates for missing data, are provisional

Theodore is the Co-Founder and Managing Editor of TravelDailyNews Media Network; his responsibilities include business development and planning for TravelDailyNews long-term opportunities.