


The domestic sector in India grew by +23% this month, the highest since January 2017.
Hong Kong – Passenger traffic across Asia-Pacific rebounded in February with +8.2% growth while a small reduction of -1% was observed in the Middle East.
India continued to lead in Asia-Pacific with approximately +20% overall growth, sustained by robust domestic demand. The domestic sector in India grew by +23% this month, the highest since January 2017. Top volume drivers for the month are: Bangalore (BLR) +34.8%, Delhi (DEL) +15.1% and Mumbai (BOM) +11.6%.
Overall growth in China reached approximately +7% in February. The timing of Lunar New Year holiday boosted international passenger travels and rendered a +15.9% increase from last year. Top volume drivers for the month include: Guangzhou (CAN) +8.7%, Shenzhen (SZX) +12.7% and Chengdu (CTU) +10.1%.
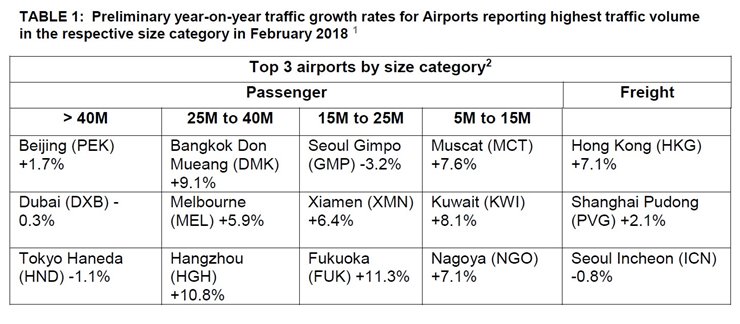
Passenger traffic continued to soften in the Middle East during the month. Dubai (DXB), the largest airport in the region recorded a marginal decline of -0.3%. The diplomatic crisis in Qatar continued to negatively impact Doha’s (DOH) traffic for the month at -11.5%. On the other hand, Kuwait (KWI) and Muscat (MCT) delivered solid growth at +8.7% and +7.6%, respectively.
In terms of air freight, Asia-Pacific and Middle East grew by +4.7% and +3.1%, respectively. The growth continued to be supported by buoyant demand on exports on the back of strengthened global economy and trade in the early part of the year. The top freight hubs are: Hong Kong (HKG) +7.1%, Shanghai Pudong (PVG) +2.1% and Seoul Incheon (ICN) -0.8%. The marginal decrease at Seoul Incheon was largely due to fewer working days during the Lunar New Year holiday.
Note :
- ACI preliminary passenger and freight statistics are based on a significant sample of airports that provide regular monthly reports to ACI. They represent approximately 60% of total passenger traffic and 70% of total freight traffic worldwide. Commentary, tables and charts are based on preliminary data submitted by participating airports and are therefore subject to change.
- Size categories refer to the annual passenger traffic (in the last 12 months)

Vicky is the co-founder of TravelDailyNews Media Network where she is the Editor-in Chief. She is also responsible for the daily operation and the financial policy. She holds a Bachelor's degree in Tourism Business Administration from the Technical University of Athens and a Master in Business Administration (MBA) from the University of Wales. She has many years of both academic and industrial experience within the travel industry. She has written/edited numerous articles in various tourism magazines.