


![[PR] PR_Ascott and Vimut Hospital_2024](https://www.traveldailynews.asia/wp-content/uploads/2024/04/PR-PR_Ascott-and-Vimut-Hospital_2024-400x265.jpg)


India continued to generate the highest growth rate in the Asia-Pacific region, backed by robust domestic passenger travel, though at a slower pace than last year.
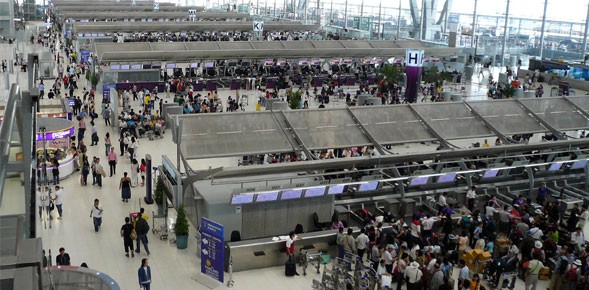
Hong Kong – Passengers traveling through the Asia-Pacific and Middle Eastern airports in July grew by +5.7% and +4.0% respectively compared to the same period last year.
India continued to generate the highest growth rate in the Asia-Pacific region, backed by robust domestic passenger travel, though at a slower pace than last year. The largest airport Delhi (DEL) recorded close to 10% growth in July. Other key passenger traffic drivers for the month include: Calcutta (CCU) +19.1% and Hyderabad (HYD) +16.8%.
In China, growth in July was primarily driven by domestic passenger traffic, but many airports continued to pursue active expansion in international routes. Among the largest hubs in the region, Guangzhou (CAN) +10.5% was the only airport that delivered double digit growth this month.
Other key passenger traffic drivers for the month include: Tianjin (TSN) +30.1%, and Xi’an (XIY) +11.3%.
In South Korea, passenger traffic suffered an overall decline of -1%, likely due to the negative impact caused by the Chinese ban for tour groups to visit South Korea since March 2017. Cheongju (CJJ) and Jeju (CJU) recorded a decline of -19.1% and -7% respectively compared to same month last year.
In the Middle East, passenger traffic showed mixed results. Qatar’s diplomatic crisis with a number of neighbouring states continued to negatively impact passenger traffic at Doha (DOH) -14.0% whereas Muscat (MCT) +25.2% and Kuwait (KWI) +24.3% both grew at a fast pace. The largest hub in the region Dubai (DXB) served over 8 million passengers in July (or growth of +5.9%) and surpassed Beijing (PEK) as the busiest airport for the month.

Note:
- ACI preliminary passenger and freight statistics are based on a significant sample of airports that provide regular monthly reports to ACI. They represent approximately 60% of total passenger traffic and 70% of total freight traffic worldwide. Commentary, tables and charts are based on preliminary data submitted by participating airports and are therefore subject to change.
- Size categories refer to the annual passenger traffic (in the last 12 months)

Angelos is the news editor for TravelDailyNews Media Network (traveldailynews.gr, traveldailynews.com and traveldailynews.asia). His role includes to monitor the hundrends of news sources of TravelDailyNews Media Network and skim the most important according to our strategy. He currently studies Communication, Media & Culture in Panteion University of Political & Social Studies of Athens.