


![[PR] PR_Ascott and Vimut Hospital_2024](https://www.traveldailynews.asia/wp-content/uploads/2024/04/PR-PR_Ascott-and-Vimut-Hospital_2024-400x265.jpg)


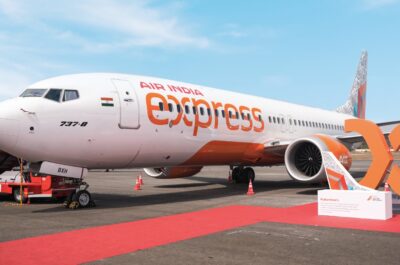
India continued to take the top spot in Asia-Pacific for December 2016 reporting outstanding increase in passenger traffic over the same period last year, driven by robust domestic passenger travels.
HONG KONG – Passenger traffic across Asia-Pacific and the Middle East delivered strong growth in December 2016: Asia-Pacific at +9.6% and Middle East at +9.4%. For the year, Asia-Pacific recorded gains at +9% and Middle East +9.4%.
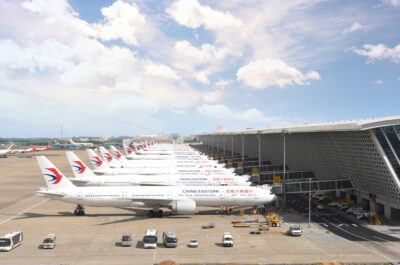
India continued to take the top spot in Asia-Pacific for December 2016 reporting outstanding increase in passenger traffic over the same period last year, driven by robust domestic passenger travels. Airports with the highest growth for the month: Chennai (MAA) +49.9%, Calcutta (CCU) +31.9%, Bangalore (BLR) +22.2%. In China, both international and domestic travels reported solid increase. Top runners for the month: Kunming (KMG) +15.6%, Guangzhou (CAN) +12.9% and Chengdu (CTU) +12.7%.
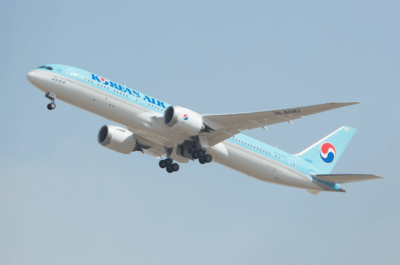
Elsewhere in the region, Seoul Incheon (ICN) registered an increase of +13.7% in December 2016. The South Korean market appears to be recovering well from the negative impact of Middle East respiratory syndrome crisis in 2015, and also benefited from network expansion by low cost carriers.
In the Middle East, passenger traffic growth sustained at a higher level in December 2016. Dubai (DXB), the largest hub in the region, received +9.3% more passengers than the same month last year. Doha (DOH) continued to generate the highest growth in the region at +15%.
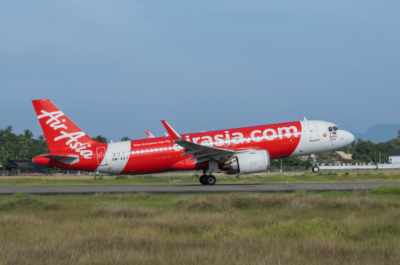
For the year 2016, overall passenger traffic growth in both Asia-Pacific and the Middle East remained buoyant. Domestic traffic grew at a fast pace in India, whereas air carriers in China actively pursued international expansion. Furthermore, low cost carriers spurred demands in various markets as competition with full service carriers intensifies. These factors are expected to support passenger growth into the first quarter in 2017.
In terms of air freight, the overall growth trajectory continued in December 2016 in both Asia-Pacific and Middle East, recording growth at +10.9 and 10.4% respectively. For the year, Asia-Pacific grew +4.5% and Middle East grew +5.8%.
The growth in Asia-Pacific, for the month of December 2016, was largely driven by increased demand for the year-end rush in perishables, electronics and e-commerce. The top three freight hubs all delivered robust increase: Hong Kong (HKG) +11.3%, Shanghai Pudong (PVG) +14.3% and Seoul Incheon (ICN) +13.8%. In the Middle East, major air freight hubs continued to report significant gains, especially in Doha (DOH) +22.6% and Dubai (DXB) +5.4%.
For the year 2016, overall air freight growth in Asia-Pacific recovered steadily since June 2016 and accelerated gradually towards year end. The increase was driven mainly by international air freight demands. In the Middle East, after a slow third quarter, overall air freight growth picked up in the fourth quarter. Doha (DOH) remained the bright spot where robust monthly growth was consistently above 20% in the fourth quarter.
TABLE 1: Airports reporting highest preliminary year-on-year traffic growth rates in December 20161
| Top 3 airports by size category2 | ||||
| Passenger | Freight | |||
| > 40M | 25M to 40M | 15M to 25M | 5M to 15M | |
| Beijing (PEK) +8.5% | Manila (MNL) +5.5% | Abu Dhabi (AUH) +3.7% | Calcutta (CCU) +31.9% | Hong Kong (HKG) +11.3% |
| Dubai (DXB) +9.3% |
Doha (DOH) +15% | Bangalore (BLR) 22.2% | Hyderabad (HYD) +21.2% | Shanghai Pudong (PVG) +14.3% |
| Tokyo Haneda (HND) +5.6% | Tokyo Narita (NRT) +6% | Brisbane (BNE) +1.1% | Busan (PUS) +11.5% | Seoul Incheon (ICN) +13.8% |
TABLE 2: Airports reporting highest preliminary year-on-year traffic growth rates for the year 20161
| Top 3 airports by size category2 | ||||
| Passenger | Freight | |||
| > 40M | 25M to 40M | 15M to 25M | 5M to 15M | |
| Beijing (PEK) +5.0% | Manila (MNL) +8.1% | Abu Dhabi (AUH) +5.1% | Osaka Itami (ITM) +2.6% | Hong Kong (HKG) +3.2% |
| Dubai (DXB) +7.2% |
Tokyo Narita (NRT) +4.7% | Nanjing (NKG) +15.9% | Busan (PUS) +20% | Shanghai Pudong (PVG) +5.4% |
| Tokyo Haneda (HND) +5.8% | Doha (DOH) +20.2% | Brisbane (BNE) +2.2% | Calcutta (CCU) +21.2% | Seoul Incheon (ICN) +4.5% |
Note:
1.ACI preliminary passenger and freight statistics are based on a significant sample of airports that provide regular monthly reports to ACI. They represent approximately 60% of total passenger traffic and 70% of total freight traffic worldwide. Commentary, tables and charts are based on preliminary data submitted by participating airports and are therefore subject to change.
2.Size categories refer to the annual passenger traffic (in the last 12 months)

Theodore is the Co-Founder and Managing Editor of TravelDailyNews Media Network; his responsibilities include business development and planning for TravelDailyNews long-term opportunities.