


Each report builds on the regional forecast by delving deeper into the changing dynamics of travel and tourism into and across the Asia Pacific region at the single destination level.
Bangkok, Thailand – Following the successful release of the “Asia Pacific Visitor Forecasts 2021-2023” early this month and in response to the continuing COVID-19 pandemic, the Pacific Asia Travel Association (PATA) is pleased to announce the third issue of a suite of 39 destination-specific reports for the period 2021-2023, sponsored by Visa. Each report builds on the regional forecast by delving deeper into the changing dynamics of travel and tourism into and across the Asia Pacific region at the single destination level. The reports also include additional data and insights from Euromonitor International.
A number of essential changes to these reports have been made in response to the extremely volatile global conditions. The first most notable change has been a reduction in the coverage period to three years, given the highly erratic situation. The second has been the development of three scenarios for each destination, ranging from mild to medium and severe. The third change is the review of each scenario to include updated data on visitor arrivals and global conditions as they appear throughout the year.
The first update will be released at the end of the second quarter of 2021, with another scheduled for early in the final quarter of the same year. This agility is considered essential to better understand the changing possibilities for the destinations under each scenario and in allowing for a more rapid leverage of potential opportunities as they present themselves. In addition, each update will be highlighted with a webinar specifically designed to provide a more detailed interpretation of what these changes may mean for the destinations and for the Asia Pacific region.
Each of the 39 reports covers a specific destination in the Asia Pacific and individually provides:
- Annual forecasts of visitor arrival numbers into each destination, by scenario and source region;
- Quarterly forecasts of visitor arrival numbers into each destination, by scenario and source region1;
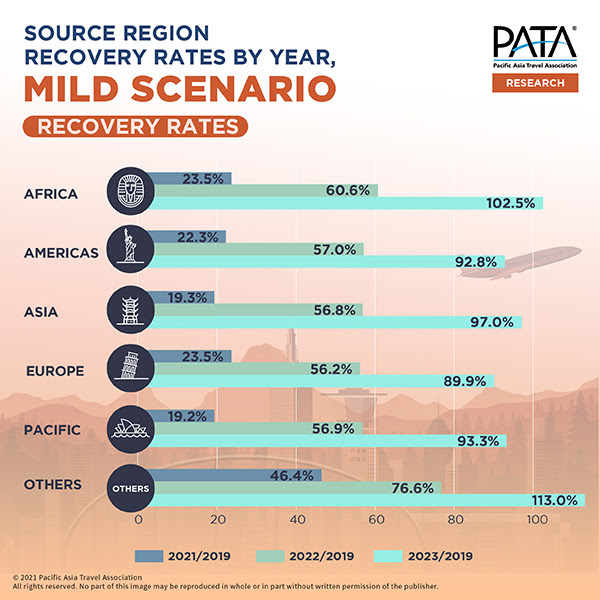
- Recovery rates for international visitor arrival (IVA) growth back to the 2019 benchmark;
- Annual changes in relative visitor share by source region, year and scenario; and
- Quarterly changes in forwarding scheduled international inbound air seat capacity.
These scenarios, when combined with other relevant metrics, provide hard data on how travel demand preferences could play out in these destinations and how they might recover under various conditions. Scheduled international inbound air seat capacity, for example, shifts relatively quickly according to demand. In other words, understanding the likelihood of when and where capacity increases become a useful barometer of potential demand that can translate into increased arrivals.
It needs to be remembered that Asia Pacific lost more than 760 million air seats into and across the region between 2019 and 2020 and while the resumption of capacity growth to 2023 can be expected, it will most likely be erratic and certainly not uniform across all the source and destination markets. Any advance indicators of capacity gains will deliver a huge strategic advantage in planning recovery processes2.
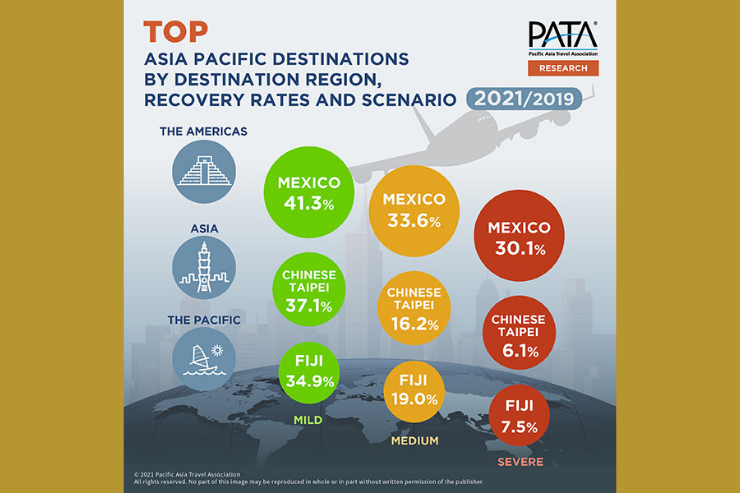
The recovery rates included in these reports present a proportion of international visitor arrivals (IVAs) in a given year, relative to the number of IVAs in 2019, expressed as a percentage. These illustrate progress by source region and scenario, into specific destinations for each year between 2021 and 2023, flagging of areas of both opportunity and continued risk, for appropriate action.
In 2021 for example, the top destinations within each of the three major regions of Asia Pacific, by individual recovery rate and under each of the mild, medium and severe scenarios, show that the best performances are likely to come from Mexico, Chinese Taipei and Fiji. Nevertheless, even those destinations at that time are still projected to have IVAs well under the levels they each received in 2019. Furthermore, as the scenarios deteriorate into medium and severe conditions, those recovery rates reduce dramatically for each of the destinations.
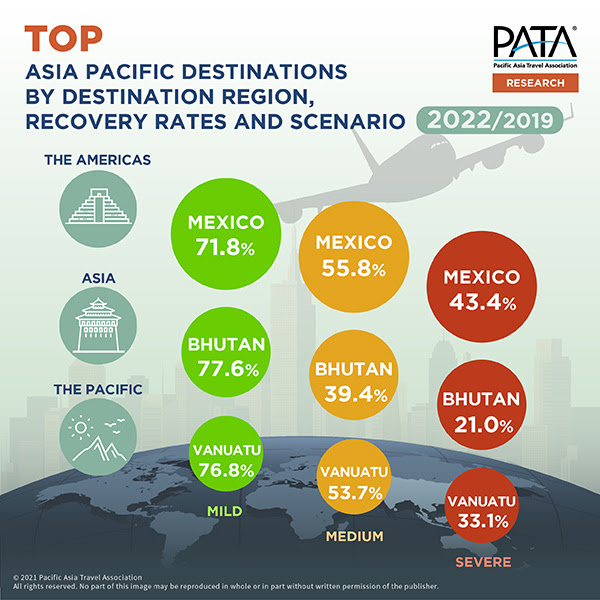
By 2022, while the recovery rates generally improve, even the best performing destinations under the mild scenario are still expected to recover back to less than 80% of the 2019 number of IVAs into each respective destination.
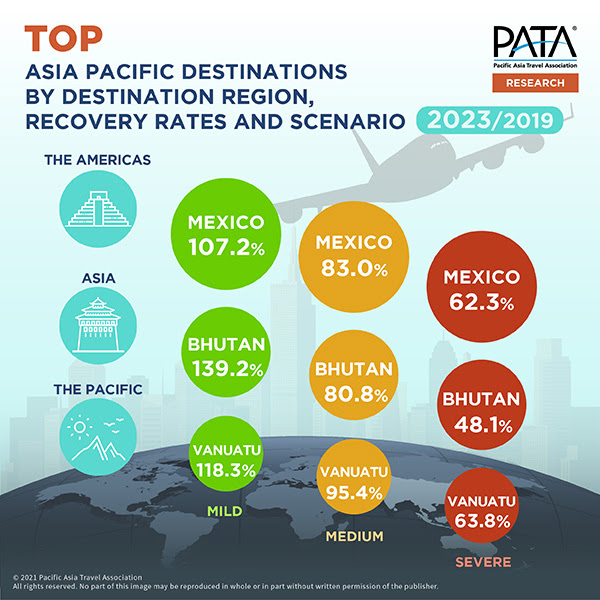
Through 2023, however, the mild scenario proposes that 22 of the 39 destinations covered (56.4%), will have returned to the pre-pandemic levels of foreign arrivals, led in recovery rate terms within each destination region, by Mexico, Bhutan and Vanuatu. Under the medium scenario, while parity with the respective 2019 volumes of foreign arrivals is still not complete, it is expected to be getting closer to that benchmark.
The severe scenario in 2023, however, suggests that all of the 39 destinations covered will still have some recovery ahead of them, with the top three performing destinations still falling short of the 2019 number of respective IVAs by more than 30% apiece.
Similar scenario outlooks are made for the source regions into each destination as well, with for example, the non-descript ‘Others’ category building in 2023 to exceed what it generated in terms of IVAs into Asia Pacific in 2019, under the mild scenario, along with arrivals out of Africa. Every other source region is projected to remain under the 2019 volume of IVAs generated into Asia Pacific for each year between 2021 and 2023.
These recovery rates of course, differ widely by individual destinations and the three scenarios.
While the recovery rates highlight the speed with which the 2019 levels of foreign arrivals from each source market into Asia Pacific are reached or exceeded, it must be remembered that there are significant differences in what they mean for increases in the absolute numbers of foreign arrivals.
According to PATA CEO Dr. Mario Hardy, “This quantitative approach to modelling recovery rates, supported with expert judgments, provides us with a strong focus on hard data that can offer a significant advantage to those destinations that best identify and cater to those source markets that first begin to grow again, once this current pandemic is brought under control.”
“In addition, with tighter marketing budgets expected in the near-term, any information that highlights source markets with strong growth potential will be essential for improving the efficiency of the limited marketing spend.”
“This series of scenario-based reports from the PATA Strategic Intelligence Centre is designed to present actionable insights at the individual destination level. We remain convinced that there will be a recovery in international travel over the next few years, although possibly not to the same levels as those of the pre-pandemic period. This suggests that the time may be ripe for developing a stronger focus on other metrics of both potential and success, including for example, time in destination, distribution across the destination and impacts on local communities, in addition to mere headcounts of inbound border crossings,” he concluded.

Theodore is the Co-Founder and Managing Editor of TravelDailyNews Media Network; his responsibilities include business development and planning for TravelDailyNews long-term opportunities.