


The new Datalex Big Book of Airline Data by IdeaWorksCompany offers passenger traffic, airline revenue, and frequent flyer info for 188 airlines from Aegean to Zhuhai.
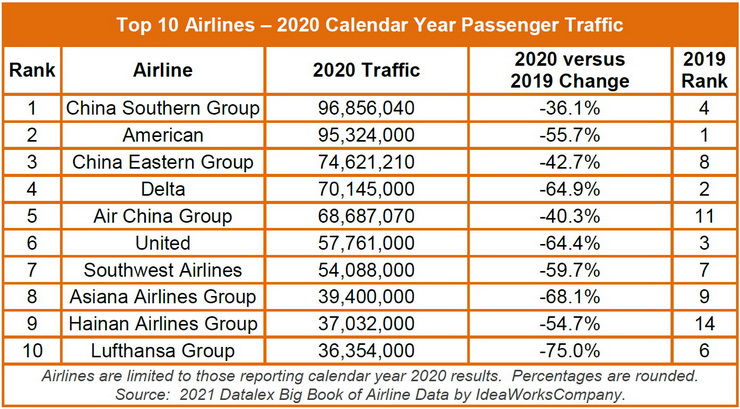
Dublin, Ireland & Shorewood, Wisconsin – Datalex, a market leader in digital commerce for retail travel, and IdeaWorksCompany, the foremost consultant on ancillary revenue, have released the second edition of The Datalex Big Book of Airline Data by IdeaWorksCompany. The 2021 edition provides a world of airline industry data collated by alphabetical order, size, airline type, region, and alliance. The 78-page “Big Book” is available free of charge via download at Datalex.com and IdeaworksCompany.com. The table below summarizes results for the largest airlines ranked by passenger traffic for 2020:
“Datalex is delighted to sponsor the second edition of the Datalex Big Book of Airline Data by IdeaWorksCompany,” said Alison Bell, SVP Global Sales & Marketing at Datalex. “This edition offers particularly interesting data comparison points between 2019 and 2020, a year like no other, in which airlines had to take unprecedented actions to survive. We applaud their resilience and hope that this Big Book will be a useful resource for all those interested in our industry.”
The data collection process for the report began in January of this year and was completed in August. It’s a significant undertaking with a review of more than 270 airlines to find traffic, revenue, and membership numbers for inclusion in the report. The information is presented in multiple formats to create user-friendly access to the data. The following is a sampling of key statistics from the Big Book:
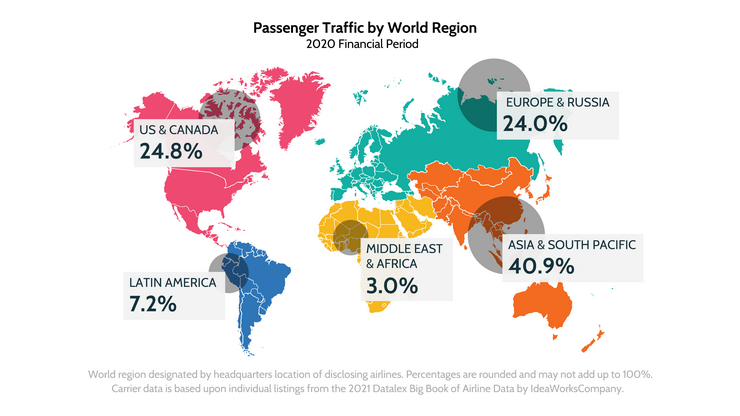
- Asia & South Pacific airlines had the largest share of world traffic at 40.9%, which represents a distinct increase above 34.6% for 2019.
- The big 4 airlines of China (Air China Group, China Eastern Group, China Southern Group, and Hainan Airlines Group), posted a 41.4% traffic drop, which was significantly below the global weighted average of 54.9%.
- US & Canada airlines had the largest year-over-year revenue drop of 63%, which was higher than the global weighted average of 55.8%.
- The world’s top 10 airlines by revenue generated $120.3 billion for 2020, which represents a 61.5% decrease from last year’s top 10 airlines ($312.6 billion).
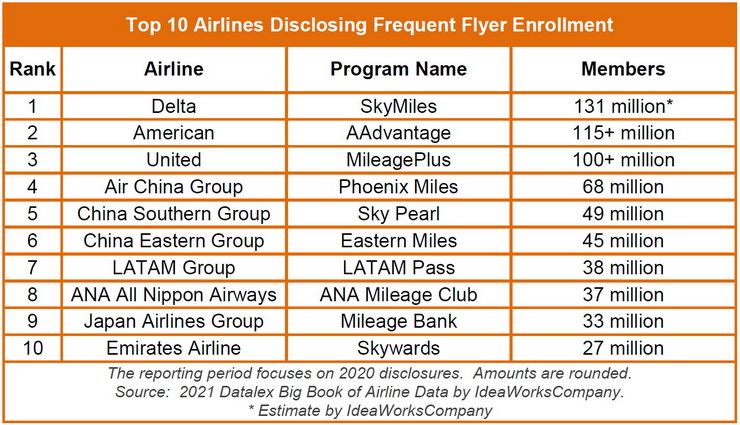
The first part of the Big Book contains passenger traffic results for 180 airlines. The second part of the report contains revenue results for 152 airlines. The final section provides membership data disclosed by 42 frequent flyer programs; the table below provides a sampling of information from that section:
The report relies upon a number of sources and methods to determine the results presented for each airline. Most often this consisted of financial documents at airline websites, while for others the sources include press releases, industry articles, and materials published by a global alliance. IdeaWorksCompany also calculated traffic and revenue for carriers for primary and subsidiary airlines. The Big Book is released on an annual basis.

Theodore is the Co-Founder and Managing Editor of TravelDailyNews Media Network; his responsibilities include business development and planning for TravelDailyNews long-term opportunities.