


In Asia-Pacific, robust domestic passenger travels continued to fuel India’s growth trajectory with many airports generating substantial increase in November 2016 over the same period last year.
HONG KONG – In November 2016, Asia-Pacific and Middle East reported passenger traffic increase at +7.0% and +12.3% respectively.
According to ACI Asia-Pacific, in Asia-Pacific, robust domestic passenger travels continued to fuel India’s growth trajectory with many airports generating substantial increase in November 2016 over the same period last year: Calcutta (CCU) +26.6%, Bangalore (BLR) +26.0%, Hyderabad (HYD) +24.7%. In China, sizable growth was observed in both domestic and international passenger travels. The top runners were: Chengdu (CTU) +22.5%, Xi’an (XIY) +14.2% and Kunming (KMG) +14.1%.
Elsewhere in the region, Auckland (AKL) posted an increase of +12.4% in November 2016 driven primarily by new seat capacity; the airport has been on a growth momentum since late 2015 and consistently reporting double-digit monthly increase.
In the Middle East, current month’s passenger traffic growth regained strength. Dubai (DXB), the largest hub in the region, recorded +9.4% more passengers than the same month last year. Doha (DOH) was the bright spot in the region delivering growth at +23.3%, its highest monthly growth thus far in 2016.
In terms of air freight, both Asia-Pacific and Middle East delivered strong results growing at +9.5% and +9.9% respectively recovering from a stagnant market that persisted from the end of 2015 to early 2016.
Current month’s growth in Asia-Pacific was largely driven by increased demand for the year-end rush, plus new cargo flows likely generated from e-commerce. The top three freight hubs all delivered robust increase: Hong Kong (HKG) +7.1%, Shanghai Pudong (PVG) +11.6% and Seoul Incheon (ICN) +9.5%.
In the Middle East, major air freight hubs continued to report significant gains in November especially in Doha (DOH) +24.6% and Dubai (DXB) +7.5%.
TABLE 1: Airports reporting highest preliminary year-on-year traffic growth rates in November 20161
| Top 3 airports by size category2 | ||||
| Passenger | Freight | |||
| > 40M | 25M to 40M | 15M to 25M | 5M to 15M | |
| Beijing (PEK) +6.5% | Manila (MNL) +11% |
Seoul Gimpo (GMP) +3.1% | Calcutta (CCU) +26.6% | Hong Kong (HKG) +7.1% |
| Tokyo Haneda (HND) +2.6% | Tokyo Narita (NRT) +6.1% | Bangalore (BLR) +26% | Osaka Itami (ITM) +4% | Shanghai Pudong (PVG) +11.6% |
| Dubai (DXB) +9.4% |
Xi’an (XIY) +14.2% | Fukuoka (FUK) +4% | Hyderabad (HYD) +24.7% | Seoul Incheon (ICN) +9.5% |
1 ACI preliminary passenger and freight statistics are based on a significant sample of airports that provide regular monthly reports to ACI. They represent approximately 60% of total passenger traffic and 70% of total freight traffic worldwide. Commentary, tables and charts are based on preliminary data submitted by participating airports and are therefore subject to change.
2 Size categories refer to the annual passenger traffic (in the last 12 months).
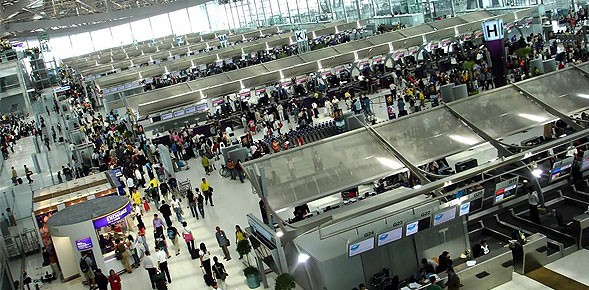
Photo caption: Suvarnabhumi International Airport, Thailand.

Angelos is the news editor for TravelDailyNews Media Network (traveldailynews.gr, traveldailynews.com and traveldailynews.asia). His role includes to monitor the hundrends of news sources of TravelDailyNews Media Network and skim the most important according to our strategy. He currently studies Communication, Media & Culture in Panteion University of Political & Social Studies of Athens.